
News, Peer Groups and Market Data
Sign-up for the latest news and insights from Enhance, delivered direct to your inbox.
Markets have been buffeted by increasing uncertainty in 2022. Putin’s invasion of Ukraine added a geopolitical shock - and a human tragedy - to an already highly uncertain economic background.
At the start of the year, equities were within touching distance of all-time highs (the S&P 500 clocked a new record high on 3rd January) but reversed rapidly through January and February to mark the fifth-worst start to a year in stock market history. With inflation readings continuing to climb, pushing to the highest readings in 40 years across the western world, bonds too experienced one of their worst ever starts to the year.
Inflation has been pushed higher by rocketing commodity prices on top of the effects of supply chains still under strain as firms rushed to meet shifts in demand as Covid-restrictions were eased across the world.
Markets moved rapidly to price in a more aggressive response from central banks, with expectations shifting towards both an even more rapid removal of emergency pandemic-related QE support and also a sharp and sustained increase in interest rates. Those interest rate rises are now underway in the UK, the US and a swathe of smaller markets, and expectations are slowly shifting towards policy shifts in Europe too.
There was already a deceleration in economic growth in progress as the post-lockdown rebound in demand faded towards more sustainable levels; adding tighter monetary policy and the crushing effect of higher energy prices to that slowing momentum raises awkward questions about the growth outlook and makes it clear that central banks have a difficult path to tread if they hope to achieve a “soft landing”, slowing growth just enough to control inflation, without slamming on the brakes and tipping into recession.
Global stock markets had already seen meaningful declines into February, with previously high flying growth stocks tending to lead the way lower, as investors digested the tricky economic backdrop and warily watched the build-up of Russian forces close to the Ukrainian border. Then, as we know, Putin unleashed a Russian invasion of Ukraine on 24th February, triggering horror and violence in what has become a major humanitarian crisis and a stain on Russia’s reputation.
As ever, amid the bloodshed, financial markets focused on the economic impacts; above all, the disruption to flows of Russian oil and gas, the risks to global food exports from the rich agricultural regions of Ukraine, the impact of sanctions on Russian firms and their global trading partners, and the risks of the war escalating further to directly involve NATO countries. Putin’s decision to increase the state of readiness of Russian nuclear forces exacerbated the situation.
It always seems trivial to look at financial market reactions by comparison to what we see on our screens and newsfeeds, but of course, these developments drove intense volatility across all asset classes. By the time it became apparent in early March that Ukraine (supported by an increasingly robust response from NATO and other allies in terms of both sanctions against Russia and material support for Kyiv), could resist impressively against what proved to be a deeply flawed invasion force, global equities had fallen around 14% from all-time highs.
For now, this seems to mark a bottom to the correction: volatility in most asset classes has eased, global stocks have rebounded around 9% from the early March low, and now stand well above their levels on the eve of Russia’s invasion. There may of course be plenty of volatility to come as markets continue to wrestle with the evolving war, and its impacts on energy markets in particular, as well as the ongoing challenge of central bank policy shifts in the face of stubborn inflation. But this episode serves as a reminder that the initial impact of geopolitical shocks can wash through financial markets very quickly: panic-selling in reaction to unexpected events can be an expensive mistake.
Two years ago, as the pandemic crushed oil demand, we briefly saw some oil prices dip into negative territory. Over the last month, with demand having recovered much faster than supply, and with the additional shock from Russia’s reduced supply to global markets, prices briefly spiked above $120/barrel for some contracts. Natural gas prices have surged too, hitting Europe especially hard. While prices have eased towards the quarter-end, helped by Biden’s decision to draw down supplies from the US’s strategic petroleum reserve, the price rises are significant and will have serious economic consequences. We have also seen price increases in commodities almost across the board, not just in energy markets. Prices for many agricultural commodities rose sharply, from wheat (where investors worry whether Ukrainian farmers can plant crops amid the invasion, on top of global concerns about rising fertiliser costs) to soybeans and orange juice to avocados. Prices of industrial metals continued to gain too; aluminium has gained over 20% this year, copper around 8%. It’s worth noting when we come on to look at indicators of a slowing global economy, that rising industrial metals prices are not usually associated with an economy rolling into recession.
While few portfolios have significant direct exposure to broad commodity indices, many investors do hold gold as part of their diversification strategy, often intended to protect against unexpected, unknown risks: this worked, in the first quarter of 2022, with Gold rising 6% to around $1935/oz (having briefly topped $2000/oz in early March).
Elsewhere, there were very few places for investors to hide - traditional diversified portfolios were buffeted on almost all sides, with equities and bonds both under pressure.
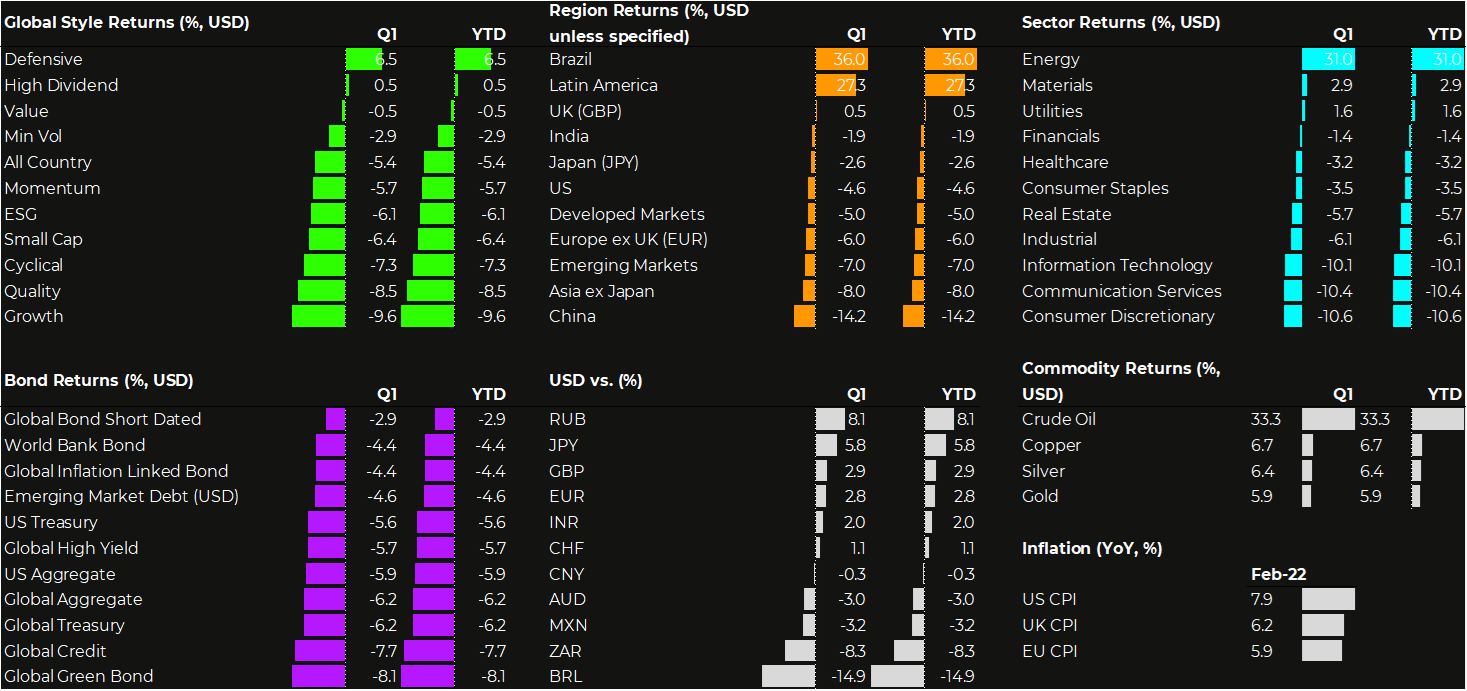
While global stocks ended the quarter down 5% (having been much lower at their lowest point), and US stocks down approximately the same amount, there were major divergences around this average. Commodity-sensitive markets saw significant gains in some cases: global Energy shares rose over 30%, and Brazilian equities rose 36% in USD terms (a sharp currency rebound helped Brazilian stocks too). Unlike most developed markets, UK large-cap equities managed modest gains in Q1, helped by the relatively large weighting of energy companies in the index. UK equities have been serial long-term underperformers, but the recovery of energy markets has now helped drive a few quarters in the sun for London-listed stocks over the past year. European equities lagged the global index, being more exposed to the crisis in gas markets, with some even speculating about energy rationing if access to Russian gas is constrained.
Chinese equities dragged down emerging markets as a whole: not only is China a major importer of oil, but it is now dealing with a significant resurgence of Covid (triggering new lockdowns in major cities including Shanghai and Shenzhen) and investors have also been concerned about the possibility of sanctions being applied to China if it is seen to be providing significant support to Russia. The Russian stock market has reopened, after a three-week closure, but with very severe restrictions. Russian stocks accounted for around 3.5% of the global emerging market index in December but were removed from the index at a value of zero in early March. This effectively accounts for around half of the 7% fall in emerging market equities year-to-date.
Value stocks outperformed Growth stocks again: Global Value was almost flat in Q1, while Global Growth equities fell close to 10%. This barely chips away at the dramatic outperformance of Growth over the last three to five years, but a world of rising commodity prices and rising interest rates has been a more supportive backdrop for commodity-related stocks and financials (which are over-represented in Value indices) than for fast-growing technology stocks.
Sterling or Euro-based investors holding US Dollars gained some benefit from currency diversification - as so often, the US Dollar strengthened in a period of market volatility, helped too by the rising interest rate environment in the US. But in bonds, investors had nowhere to hide: rising inflation, rising interest rates and very low starting yields were a toxic recipe.
Global aggregate bond indices have now experienced their biggest drawdown in at least 40 years: Q1 returns for global bonds of -5% were roughly equivalent to the losses on equities. US inflation-linked bonds (TIPS) experienced slightly lower losses, with rising inflation expectations partially offsetting higher underlying yields, but losses elsewhere were painful. Investment-grade corporate bonds sold off on average over -7% - worse than global equities - as a higher risk environment meant that credit spreads widened over and above underlying government bond yields. Emerging market bonds were hit hard too, especially USD-denominated bonds, where the threat of impending Russian debt default has sent credit spreads wider.
This bond market action reflects the evolution of central bank policy in the face of a narrowing path to a soft landing. Short-dated bond yields have risen particularly sharply, reflecting expectations of significant near-term interest rate rises. Yields on longer-dated bonds have risen less, resulting in a much flatter, or even partially inverted, yield curve: i.e. higher yields on short-maturity bonds than on longer maturities. Yield curve inversions are quite unusual and they often signal market expectations of a recession coming somewhere down the track, implying that central banks may need to change course to avoid a more significant slowdown: markets have started to price in rate cuts in the US as early as 2024.
An inverted yield curve is not a fail-safe signal for recession, perhaps, especially in today’s markets which have been distorted by QE, and there have been false alarms in the past. Every recession since the war has indeed been foreshadowed by a yield curve inversion, but not every yield curve inversion has then been followed by a recession. Where the signal has worked, the lags have been significant, with recessions on average starting over 1.5 years after the yield curve inverted. But investors will be watching this indicator closely and will likely be increasingly sensitive to any data suggesting a slowdown in growth.
Investors continue to face the strategic dilemma of how to construct a well-diversified portfolio when traditional diversifiers, such as Treasuries and corporate bonds, offer low yields and can’t be relied on to protect portfolios at times of trouble. But as yields have ratcheted higher, and if investors look ahead to the next economic cycle, that picture may start to change. US 10yr Treasury yields have climbed from 0.5% two years ago, to 1.5% at the end of 2021, to 2.5% now, some will feel that the balance is starting to shift, and bonds can again be part of the solution - particularly if inflation comes down and growth shifts lower.
In 2021, rising energy prices were the result of a strong rebound in economic growth. In 2022, the picture has shifted: high energy prices threaten to undermine economic growth, eating into household spending and corporate profit margins, and pushing central banks into more aggressive tightening. While higher fossil fuel prices may deliver long-term benefits, incentivising the transition into low-carbon energy alternatives, the short-term effects are potentially very challenging.
Energy prices typically have both near-term inflationary and medium-term disinflationary consequences. Rising prices feed through the economy, not just through direct spending on petrol, gas and electricity; the subsequent second-round effects are from higher costs faced by businesses, which they try to pass on where they can - as transportation and distribution, chemicals and plastics, all become more expensive. But in the medium-term, rapid rises in energy prices eat up consumers’ disposable income: as we spend more on fuel, heating and powering our homes, we have less to spend on other goods and services. So, often with a lag, we can track the impact of higher oil and gas prices showing up in softer consumer demand. The increase in price caps in the UK domestic energy market means this shock is just now being unleashed on households there, and this is a global phenomenon.
Central banks are in a tricky position then, facing higher inflation and threats to growth: possible stagflation. They cannot influence the oil price and its consequences for inflation and growth: they can only attempt to blunt demand in other parts of the economy, to stem inflation in those sectors. But this will be happening anyway, as consumers are forced to spend more of their incomes on energy. The blunt tool of interest rate rises, if applied too hard to an economy where households are feeling the pinch already, could cause an unnecessarily sharp slowdown.
Consumer sentiment data in the key industrialised economies is already showing some signs of strain: rising mortgage rates, higher energy bills and screens dominated by a European war are outweighing what remains a very healthy job market (payroll growth remains strong, and unemployment is close to record lows). There are some signs of slowing momentum in consumer spending, as households burn through the savings they accumulated during the pandemic, and wage rises lag surging inflation, but this is not yet decisive; recent surveys of business sentiment in both manufacturing and services still point towards growth in key economies, albeit clearly slowing from the explosive growth seen in the post-lockdown recovery. Investors will be focusing closely on changes in emphasis from central bankers: at what point would concern over the growth outlook start to prompt a shift in the trajectory of interest rate rises? The risk of a central bank policy mistake - or another severe market reaction - is meaningful, particularly while central banks stay more focused on upside risks to inflation than on downside risks to growth.
Amid all the uncertainty, it’s worth recalling the experience of past economic cycles. Recessions happen, but not after every yield curve inversion, and even when the yield curve sends a warning, a recession usually takes a year or more to arrive, with stock markets historically gaining on average in the year after yield curves invert. Bear markets happen, but they tend to happen nearer the end of periods of rising interest rates, not near the start: again, stocks have tended on average to gain in the six months after the US Federal Reserve starts increasing interest rates.
Markets are facing challenges and complicated headwinds, but investors can still look to navigate sensibly through this period. The end of QE and the start of interest rate rises promises a choppier environment, and Russia’s impact on oil markets clouds the picture further. Investors could become more worried about the risks of a sharp economic slowdown and are sensitive to the scope for a central bank policy mistake: an inverted yield curve could be a bellwether of recession to come. History warns us to beware of being too cautious, too soon, but it makes sense to be prepared for further volatility as 2022 unfolds.
N.b. All content is based on data at the time of writing on 7 April 2022.
Sign-up for the latest news and insights from Enhance, delivered direct to your inbox.
