
News, Peer Groups and Market Data
Sign-up for the latest news and insights from Enhance, delivered direct to your inbox.
We end this quarter in a world knocked off its usual axis by the coronavirus pandemic, with the unfolding tragedy of tens of thousands of deaths hanging over us, and all of us facing extraordinary disruption in our daily lives. For many, questions of family, health, safety and the possibility of redundancy, furlough or business failure are at the forefront. While acknowledging all of this, we offer our review of investment markets over the quarter.
 USD return against respective currencies
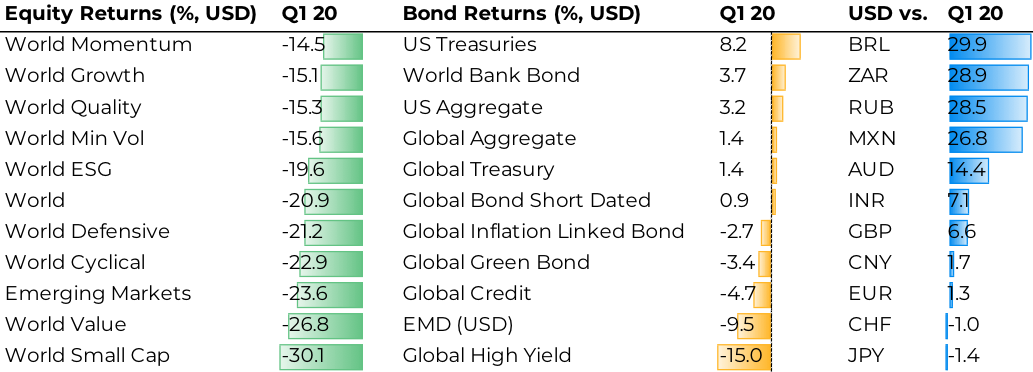
The bull market that started the prior decade has ended. Global equities recorded falls of over 20% (in USD) for the quarter as a whole – a little worse for Europe including the UK and Emerging Markets (excluding China), a little better for the US and Asia including Japan. China was a major exception amongst the major economies, as Chinese stocks lost “only” -10%. This statistic, shocking in itself, masks far more violent peak-to-trough movements and market stress. Index behaviour through the quarter is a story of superlatives. The fastest, most violent bear market (in terms of a 20% fall from an all-time high) ever seen for the FTSE or the S&P500 since at least the 1930s; the highest levels of index volatility ever seen; followed by a violent rally, with – for some markets – the strongest three-day bounce ever seen.
While it was a story of devastating falls across almost all markets, there are notable relative performance trends that will have differentiated fund manager performance. In many cases, the winners of late 2019 were the biggest losers of Q1 2020. Commodity-related markets – Russia and Brazil – were hit very hard, as prices of energy and industrial metals fell sharply. Commodity-related currencies tumbled as well, not just in Emerging markets where Brazilian Real, SA Rand and Russian Rouble all fell more than 20% against the US Dollar, but also among developed markets: the Norwegian Krone fell 15% and Australian Dollars by over 12% against the US currency. UK equities, especially the small and mid-cap stocks that had rallied in Q4 on relief that a way forward on Brexit seemed clearer, were among the worst performers in the last quarter, perhaps undermined by global perceptions of a slow response by the government to the pandemic threat. Additionally, the reversal of the Pound’s previous strengthening in Q4 2019 will have exacerbated losses for overseas investors holding UK assets as it deprecated 6% against the US Dollar. In other cases, relative winners in the market surge to December remained relative winners in the sell-off: Chinese equities were among the strongest relative performers internationally in Q4 and again in Q1 as a whole, arguably supported by investor perception of the pandemic being largely contained in China by late March. Elsewhere, large-cap growth stocks in the US, and the technology and healthcare sectors more broadly, were relative winners both in late 2019 and early 2020. On the other hand, investors backing Value strategies or overweight energy stocks suffered in the market run up (as these segments lagged the broader equity rally) and suffered far more in the sell-off: Value stocks fell much more sharply than broader market indices and energy stocks were devastated, with the global energy sector losing almost 45% in the quarter.
Investors had few hiding places: a great swathe of assets held by managers to provide portfolio diversification were caught up in the market turmoil. Commodities, property, leasing and specialist debt funds were sold off sharply, in some cases devastatingly. More economically sensitive assets like listed private equity and high-yield (or “junk bonds”) fell sharply, as investors priced in a wave of corporate failures and frozen funding markets: at the worst point, high yield bonds (with a credit spread, or excess yield of over 10% above US Treasuries) were pricing in defaults of well over half of borrowers over the next five years. The majority of accessible ‘absolute return’ funds now also show losses over the last twelve months. Emerging market bonds saw significant losses: US Dollar denominated EM debt fell almost 10% in the quarter, and local currency bonds fell by over 15%, with losses exacerbated by weakness in emerging market currencies, particularly in commodity-heavy economies. Infrastructure – of the widely-held ‘alternative assets’ we see in portfolios – has provided some form of haven, with high quality state-backed social infrastructure and renewable energy assets generally down by only a few per cent over the quarter.
Although commodities sold off broadly, as markets priced in a decline in industrial demand, energy markets took a particularly wild ride. Oil prices were squeezed over $60 a barrel in early January amid escalation of tensions between Iran and the US, with Iranian missile attacks on US bases in Iraq taking us closer to direct conflict between the two states. By the end of the quarter, crude oil prices stood a few cents above $20 a barrel, prices collapsing to their lowest levels in 17 years as a price war between Russia and Saudi Arabia ensured continued high production in the face of a catastrophic fall in demand induced by virus lockdowns. Markets are currently pricing this as a transient dip: oil futures for delivery in Dec 2020 are priced closer to $35/bl. In theory one can buy oil today at just over $20/bl, enter a contract to sell it for $35/bl in December and make a healthy profit – but only if you can store it in the meantime. Hence oil storage facilities are filling fast and market players are looking at unconventional ways of storing oil, for example chartering tankers to store, rather than to move oil.
By contrast, core government bonds proved their worth – notably US Treasuries and UK Gilts – returning 6-8% for the quarter. Inflation-linked bonds were less impressive by comparison and suffered as markets priced in a higher risk of deflation. In benign conditions, investors may be tempted to reject the strategy of holding significant allocations to government bonds, understandably viewing historically low yields as offering the prospect of poor long-term returns. But this episode underlines again that no matter how low bond yields appear to be, crisis conditions can still force yields lower – to zero and below – as investors seek security at any price. But even here, it was not straightforward: bond yields reached their lowest point for the quarter on 9 March, a fortnight before the trough for equities: in the subsequent period of most intense market stress even high quality government bonds gave back some gains, weighed down by concerns over deteriorating public finances and swept by rumours of margin calls and redemptions by stressed hedge funds.
Gold is often held in portfolios as a hedge against unknown risks and it performed that function relatively well in Q1, gaining a little over 5% in US Dollar terms. Similarly to bonds, gold was strongest in the early phase of the sell off, peaking on 6 March and giving back some gains over the subsequent fortnight. That short period of most intense market stress, with equities, Treasuries and gold all selling off simultaneously in panic conditions and looking to raise cash wherever possible, showed some characteristics of a capitulation point, the intensity of selling, correlations shifting up and peaks of volatility that have marked past bear-market bottoms.
Some managers held higher than average allocations to cash before the sell-off; while this can only dilute negative market impacts, rather than providing meaningfully positive returns in itself, the “optionality” that cash offers can be priceless: that is to say, investors holding high levels of cash now, after a substantial market fall, have the option to deploy that cash, potentially acquiring attractive assets at distressed prices. A very few managers, but inevitably including some high profile names, held effective market hedging strategies (for example, index put options or strategies designed to pay off if market volatility rose). These were few and far between, considered by many to be unattractive due to their very high cost or the need to call the timing of a market decline with unlikely precision.
The question of managers’ approaches to diversification, the roles that different assets play in their portfolio construction, and the stress-testing of portfolios has always been crucial, but perhaps never more so than today.
It’s worth examining the timeline of the market crash in a little more detail. Hindsight, and the compression of so much into such a short period, can lead us into characterising the sell-off as a single episode, but attempting to differentiate the phases of the quarter can be informative. At the turn of the year, a sense of measured optimism was seen from most investment strategists: the economic cycle was maturing, but few saw significant risks of recession in at least the next 12-18 months. Many strategists highlighted potential risks to their views, but these clustered around geo-political risks, from the Middle East to North Korea, the possibility of flare-ups in the USA’s trade wars, or other known threats, from climate change to cyber-security. Not a single one of the dozens of investment strategy reports we read over the turn of the year mentioned the threat of a pandemic as a significant risk; yet here we are. Until mid-February, markets were buoyant despite the fact that China was in full lockdown already as the first country being affected, having rebounded from January’s geo-political tensions with Iran. The global economy was on a steady expansion track, helped by an easing of US-China trade tensions and a loosening of US monetary policy, which looked set to prolong an already-long upswing. As stocks reached what we now see to be the peak on 19th February, the novel coronavirus was a topic of investors’ leisure conversation, rather than a major concern: it was perceived as a Chinese problem, with 75,000 confirmed cases in total and less than 1,000 seen outside the country (according to the WHO daily Situation Reports). Italy had reported 3 cases, Spain 2, the UK 9, and only one patient had died in Europe. The next day, Iran reported its first two cases. Both were fatalities, immediately raising concerns that the disease could be much more present in Iran but under-reported.
A week after the all-time high for stocks, equities were under clear pressure: the S&P 500 had fallen 8%. But even then, observers could have regarded the COVID-19 epidemic as relatively contained: 3,000 cases had now been reported outside China, but these were strongly concentrated in South Korea and Italy, with more cases on a single cruise ship than had been reported in the whole of Europe.
Complacency unravelled with shocking speed. By 9 March (when bond yields troughed and gold had peaked), the WHO reported 29,000 cases outside China. Although over 100 countries around the world were affected, even at this point some observers might have felt that the situation was not out of control: the vast majority of these cases were still seen in Italy, Korea and Iran (with around 7,000 each), and cases in China were rising very slowly, with very few new cases seen outside Hubei province. Spain had ‘only’ 600 cases, the US only 200. The UK had seen 2 fatalities at that point, the US 11. However, WHO was considering already that the Covid-19 should be classified as a pandemic and made the official announcement two days later.
The S&P 500 had fallen almost 20% from its peak by 9 March, but worse lay ahead as the disease appeared to spread uncontrollably: the next two weeks marked the period of most intense stress for financial markets, as bonds and gold sold off alongside equities. By 23 March, which may or may not in retrospect prove to be the market trough for the coronavirus crisis, the disease appeared out of control across Europe and the US. Confirmed cases globally topped 300,000 (with the true number likely far higher); over 200 patients died that day in the US, over 600 in Italy, with Spain on a similar trajectory. The grim statistics in all would get much worse, with the US experiencing over 200,000 confirmed cases by early April (with New York alone experiencing more cases than China, and the highest recorded per capita infection rate in the world[1]). Yet, for now, this market trough has held: we close the quarter with the S&P 500 15% above its trough, and comparable rises for many other equity markets.
How should we understand this bounce? Can investors feel confident that the worst is behind us? A few market strategists are beginning to make that call and proposing tentative reallocations into risky assets, if not into equities then perhaps into corporate and high yield bonds, which now price in unprecedented levels of company defaults. Others understandably remain cautious, pointing out that although the market fall has been severe and the recent selling frenzy carried echoes of past market bottoms, little more should be read into the rebound since 23 March: other bear markets have been punctuated by such rebounds, not least the post-Lehman bear market, during which the S&P 500 saw four ‘false-dawn’ rallies of at least 10% before the market finally troughed.
Perhaps precedent may not be much of a guide here given the cause for the market downturn is distinctively different this time, so much depends on medical and epidemiological developments, specifically on public health measures to curtail the spread of the disease: Italy implemented a nationwide lockdown on 8 March, followed by governments tightening social distancing measures across Europe, with the UK finally entering lockdown on 23 March (which coincided with market bottom, only time will tell if there is any connection between the two). These sequential lockdown efforts are apparently having some success, with data confirming slowdowns in the rate of new infections and fatalities around ten to fifteen days after the imposition of tight lockdowns. But there is much still to do and where things go from here will depend on the ramp-up of intensive care facilities, on medium-term improvement of therapeutics and longer-term development of vaccines, and ultimately (perhaps the most uncertain question of all these) on the possibility and scale of second and subsequent waves of infection when the current intense lockdown period ends.
Investors may have little clarity and face persistent anxiety around the potential for further waves of the pandemic, but it is clear that markets have taken comfort from policymakers’ actions to cushion the economy. There is no doubt that the world faces a shocking and sharp recession. We will not see hard data readings on the economy for some time, so for now can only rely on more timely economic data such as weekly unemployment benefit claims, and on surveys and leading indicators to estimate the economic damage which is clearly devastating. In the last week of March, 3.3 million Americans filed new claims for unemployment benefit (the previous highest weekly rise was 695,000 in the early 1980s recession); this alone is consistent with at least a 2% rise in the unemployment rate. In the first week of April, a further 6.6 million Americans filed claims pointing to a 6% rise in the rate of unemployment in the space of a fortnight, a speed like nothing seen before In the UK, 950,000 new claims for Universal Credit benefits were filed in the last two weeks of March, compared with 100,000 typically seen in a two-week period. Leading indicators of economic growth, such as the widely followed PMI indices, had showed a healthy picture in most economies in February: preliminary (“flash”) readings in late March however showed a catastrophic fall, the sharpest ever recorded in the data series for the US, Eurozone and UK. The PMI reports paint a picture of new orders collapsing, especially export orders; of business activity freezing, employment collapsing; of services hit much harder than manufacturing, with sectors like general retail, leisure, travel and tourism hit the most. The PMI reports also noted sharp falls in prices as firms at every stage of supply chains tried to shift inventory in the face of crumbling demand. It will be months before official statistics quantify the scale of the recession that we face, but these leading indicators are consistent with a severe slowdown: terrible economic headlines for the months ahead are an absolute certainty. China offers a sliver of hope: as the economy emerges from lockdown earlier than others, leading indicators like the PMI suggest a stabilisation. Manufacturing in March was no worse than in February, and firms hold some confidence that conditions will improve. However, to what extent this relative positivity can persist as the rest of the world followed its steps into economic shock is yet to be seen.
It is clear that the recession will be deep and painful. The key question is whether firms can be supported to remain in business through the freeze, to retain employees and productive capacity, allowing a healthy rebound when lockdowns are eased. Or will we see a more damaging hollowing-out of the economic base, with productive capacity being lost altogether, condemning us to a slow rebound and reducing long-term growth potential? This is the clear focus of central banks’ and governments’ economic policy.
Unprecedented global risk has demanded an unprecedented response. Largely, this is what we have seen – policymakers’ response to the crisis, both central banks and governments, has been unprecedented in speed, scale and scope. This picture applies globally, across most of the major governments and central banks, with varying details and timelines, but the US measures may be the most important in setting the tone for global markets. In just two weeks in the second half of March, US policymakers announced total measures likely to exceed 30% of GDP, dwarfing the response to the 2008 financial crisis which totalled approx. 10% of GDP in the US, although over a much longer period. In two weeks beginning 15 March, the US Federal Reserve announced at least a dozen significant policy steps (more than the entire 2008-09 period), cutting interest rates close to zero, boosting purchases of government bonds (QE), reviving some financial crisis programmes (such as the Term Asset-Backed Securities Loan Facility (TALF), designed to ensure credit continued to flow to households and small businesses) and creating an alphabet-soup of new emergency measures, notably programmes authorised to purchase corporate bonds and bond ETFs (PMCCF & SMCCF). It is likely no coincidence that the announcement of the TALF and of corporate bond purchases marked the stock market trough for the quarter: investors could see the Fed on the front foot, taking decisive and unprecedented action, and quelling concerns over a liquidity or lending freeze, or broader market dysfunction. In total, the Federal Reserve measures could provide support to the tune of $4-5 trillion, equivalent to 20% of US GDP.
Compared to the monetary policy response, the US government’s fiscal response to support businesses and households in the downturn was slower than some measures put in place in Europe but, given its scale and scope, the passage of the Coronavirus Aid Relief & Economic Security (CARES) Act through a divided House was relatively smooth (early setbacks in its passage likely contributed to the equity market weakness up to 23 March, but as the bill passed the Senate unanimously on 25 March the CARES Act appears also to have been a key plank in underpinning the stock market in the final days of the quarter). The CARES Act is unprecedented in its speed, historic in scale (it provides support totalling $2.2 trillion, or around 10% of GDP[2]) and ground-breaking in scope: not only does it provide loans to businesses large and small, boost unemployment benefit payments, and increase support to hospitals and healthcare, it also (like many European emergency fiscal programmes) provides direct payments to individuals. There is every reason to expect that having gone “all-in” on the fiscal response to the crisis, many governments will expand and extend programmes as needed if the virus necessitates longer lockdowns and deeper freezes of the economy: as UK Chancellor of the Exchequer Rishi Sunak said, borrowing former ECB chief Mario Draghi’s Eurozone crisis language, they will do “whatever it takes” to protect the economic infrastructure.
Despite its awesome scale, it is wrong to call the fiscal and monetary policy responses a stimulus; we should think of them as a cushion, an emergency safety device attempting to ensure that as many businesses as possible are able to hibernate rather than die; and that households are able to contribute to the strongest possible recovery when the virus threat is overcome. But given the scale of the response, it is understandable that some investors worry about side-effects or unintended consequences of these policies (as they did in response to the successive waves of quantitative easing (QE) after 2008). Given the scale of the threat, there is a strong argument that policymakers are right to go for these emergency fixes now and worry about side-effects later. But there will be consequences, even if these are not yet certain. Government deficits will rise as previously seen only in wartime (in the US, from a prior expectation of around 4.6% to as much as 15% this year – and similar rises for many other borrowers); this could cause stresses for some countries, particularly those borrowing in other currencies, such as emerging markets. It will have long-term implications for sustainable public finances, i.e. balancing between tax and spending. Some investors fear an inflationary impulse from the expansion of central bank balance sheets (“printing money”) and government pay-outs; this may be unlikely in the short-term, with collapses in activity and widespread slack in the economy suggesting it will be hard for inflation to take hold (outside specific goods in shortage), this fear may stalk investors for years to come after the crisis none-the-less.
We close the quarter with financial markets regaining some poise; volatility remains high, but well below the peaks seen in mid-March. Stock markets stand significantly below their all-time highs of February, but for now the troughs seen in late March have held. Data releases are starting to reveal the extent of the economic damage unleashed by the virus while markets are trying to gauge how successful policymakers’ extraordinary steps may be in limiting this damage and creating the conditions for a rebound. Above all, markets are focused on the medical and public health responses and changing trends in testing, infection rates and fatalities. The key questions are: how long must lockdowns be extended, and how vulnerable are we to second and subsequent waves of infection when attempts are made to resume normality? The answers will take shape over the next few crucial weeks and months.
All content is based on data at the time of writing on 3rd April 2020.
Data Source: Bloomberg
[1] https://www.dbresearch.com/PROD/RPS_EN-PROD/PROD0000000000506525/Corona_Crisis_Daily.PDF
[2] For comparison, the American Recovery and Reinvestment Act (Feb 2009) was politically contentious (no Republican support in Congress), far smaller (around $830bn) and far slower (it passed five months after the fall of Lehman Brothers).
Sign-up for the latest news and insights from Enhance, delivered direct to your inbox.
